IoT Platform
Empower engineers creating the future of connectivity.
Role User Research, UX & UI Design
Company West Pharmaceutical Services
Year 2024
Empower engineers creating the future of connectivity.
Role User Research, UX & UI Design
Company West Pharmaceutical Services
Year 2024

The pharmaceutical industry is driven by two pillars that shape a company’s success: quality and efficiency.
Internet of Things (IoT) has a key role to play as it empowers factories to track and monitor the proper functioning of the line assembly.
Those data are sent to a cloud platform for monitoring. Engineers are the end users of this platform and implement data transformation as well as dashboard application.
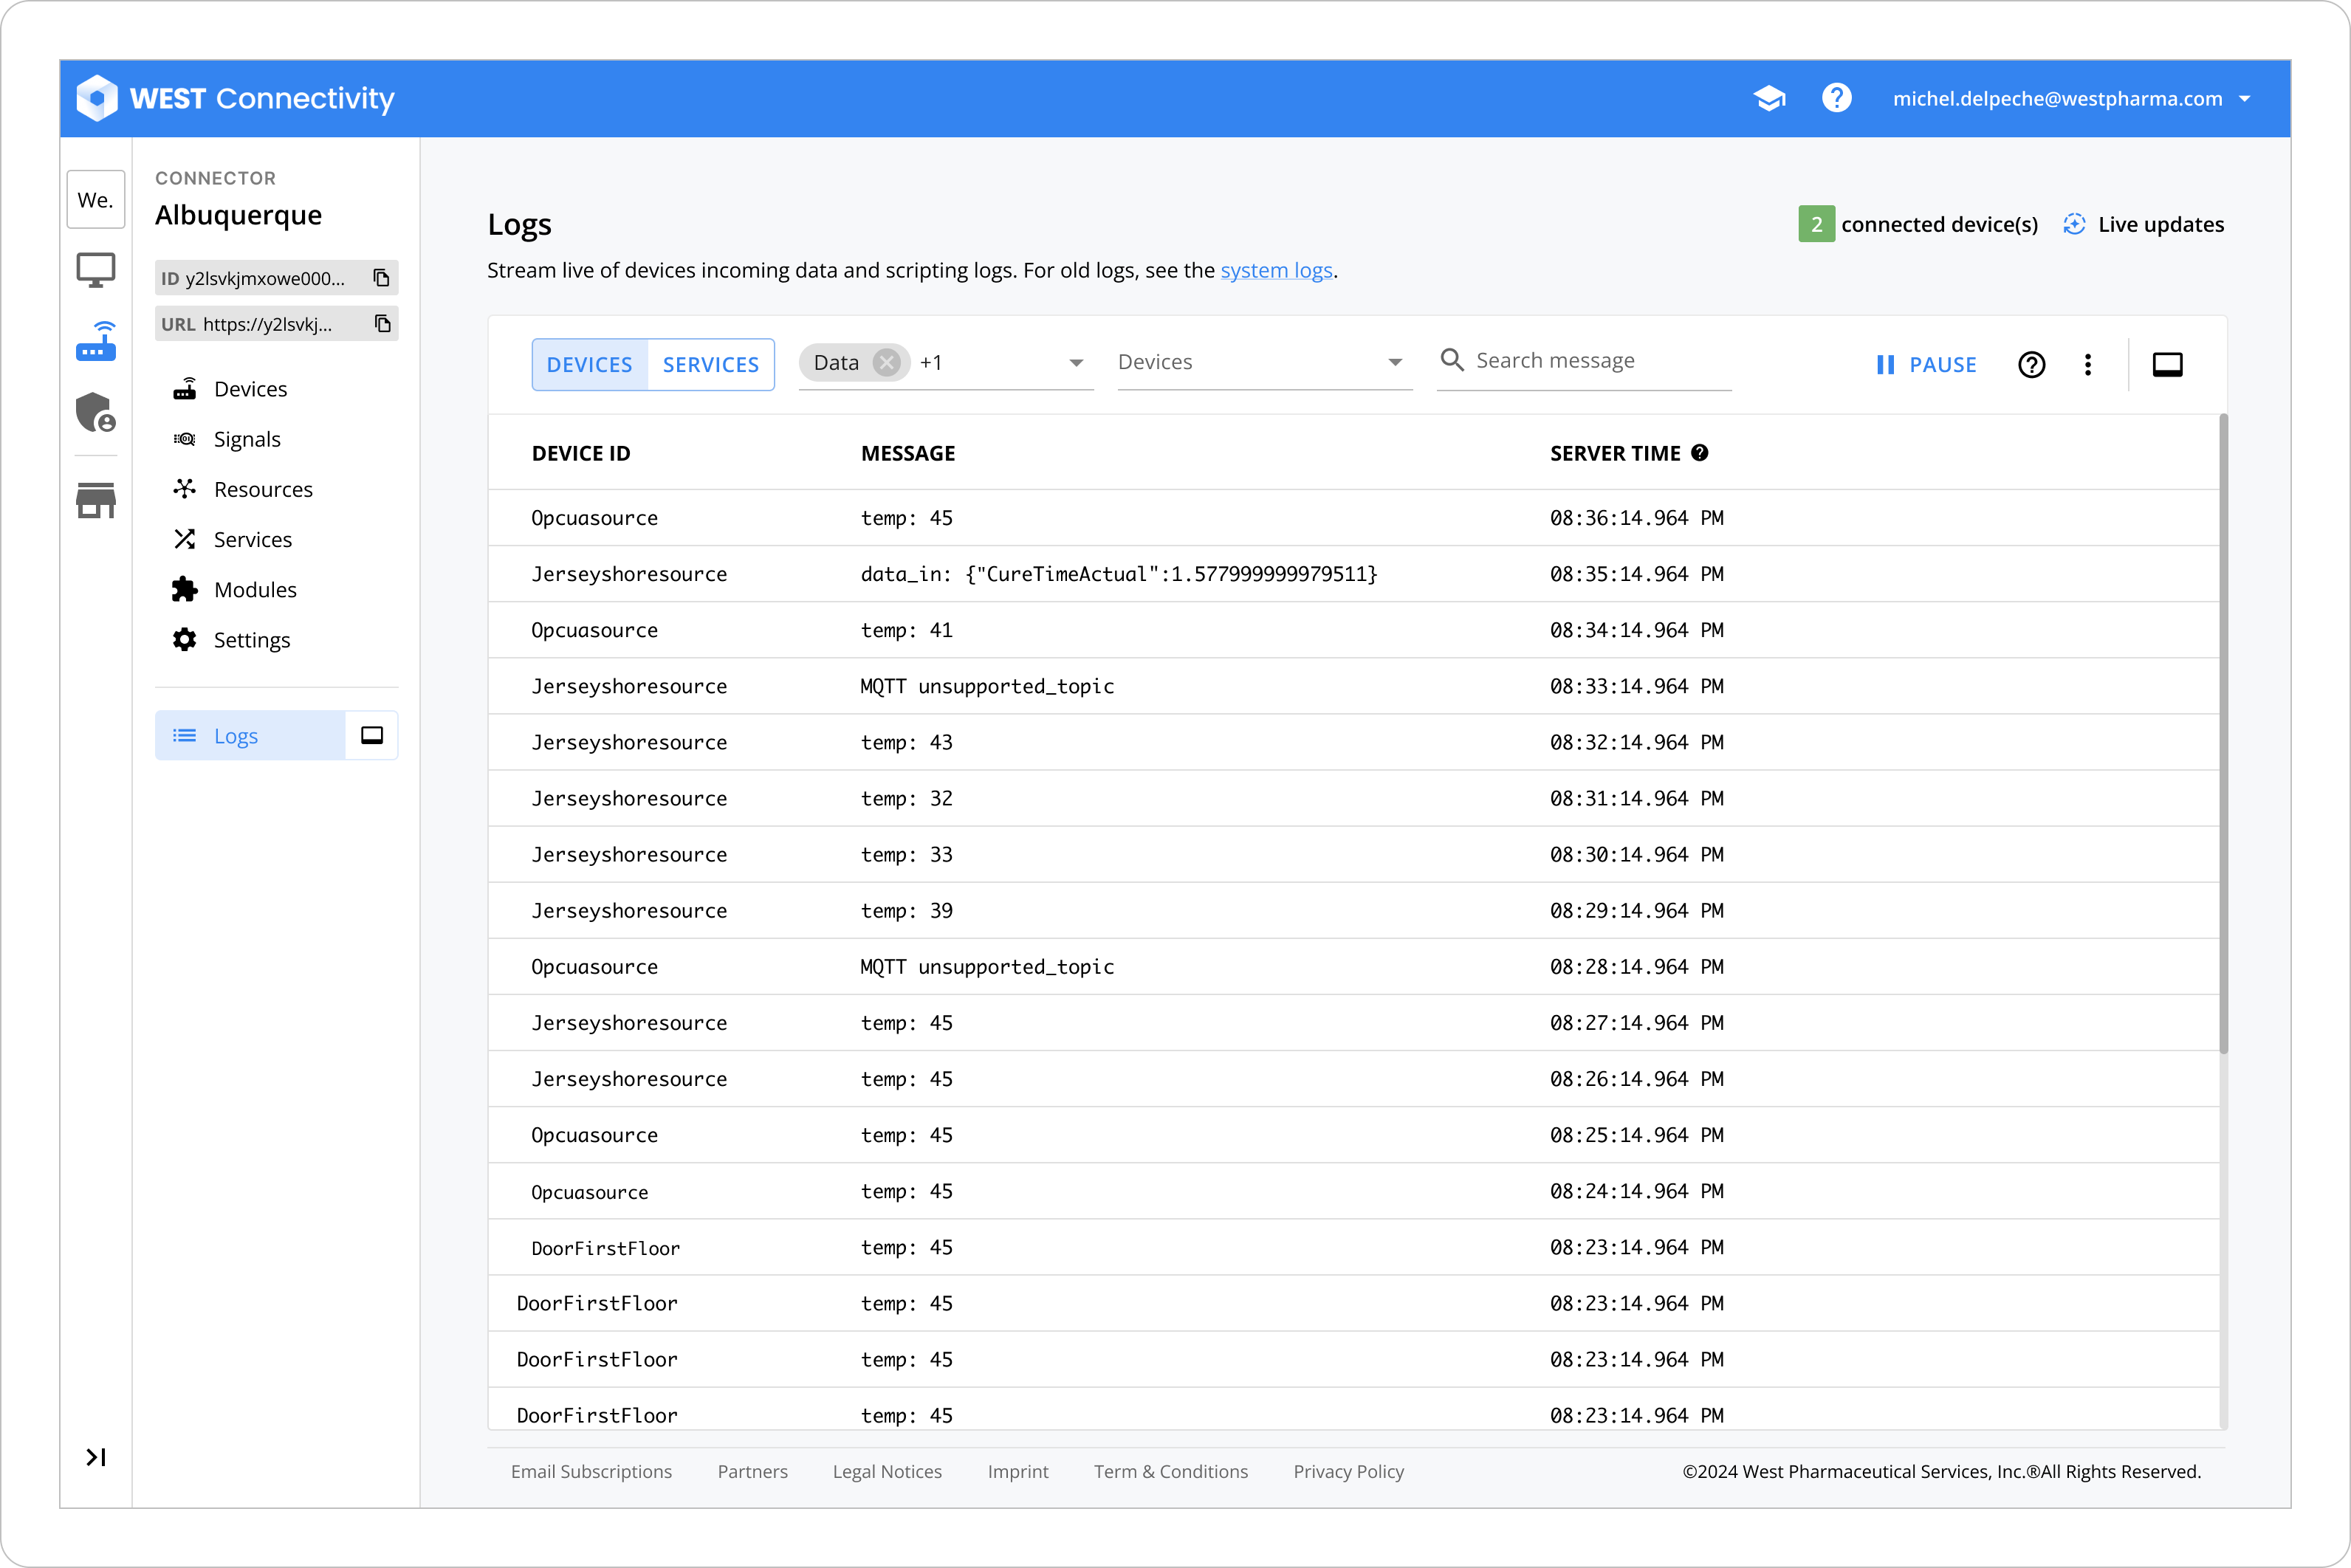
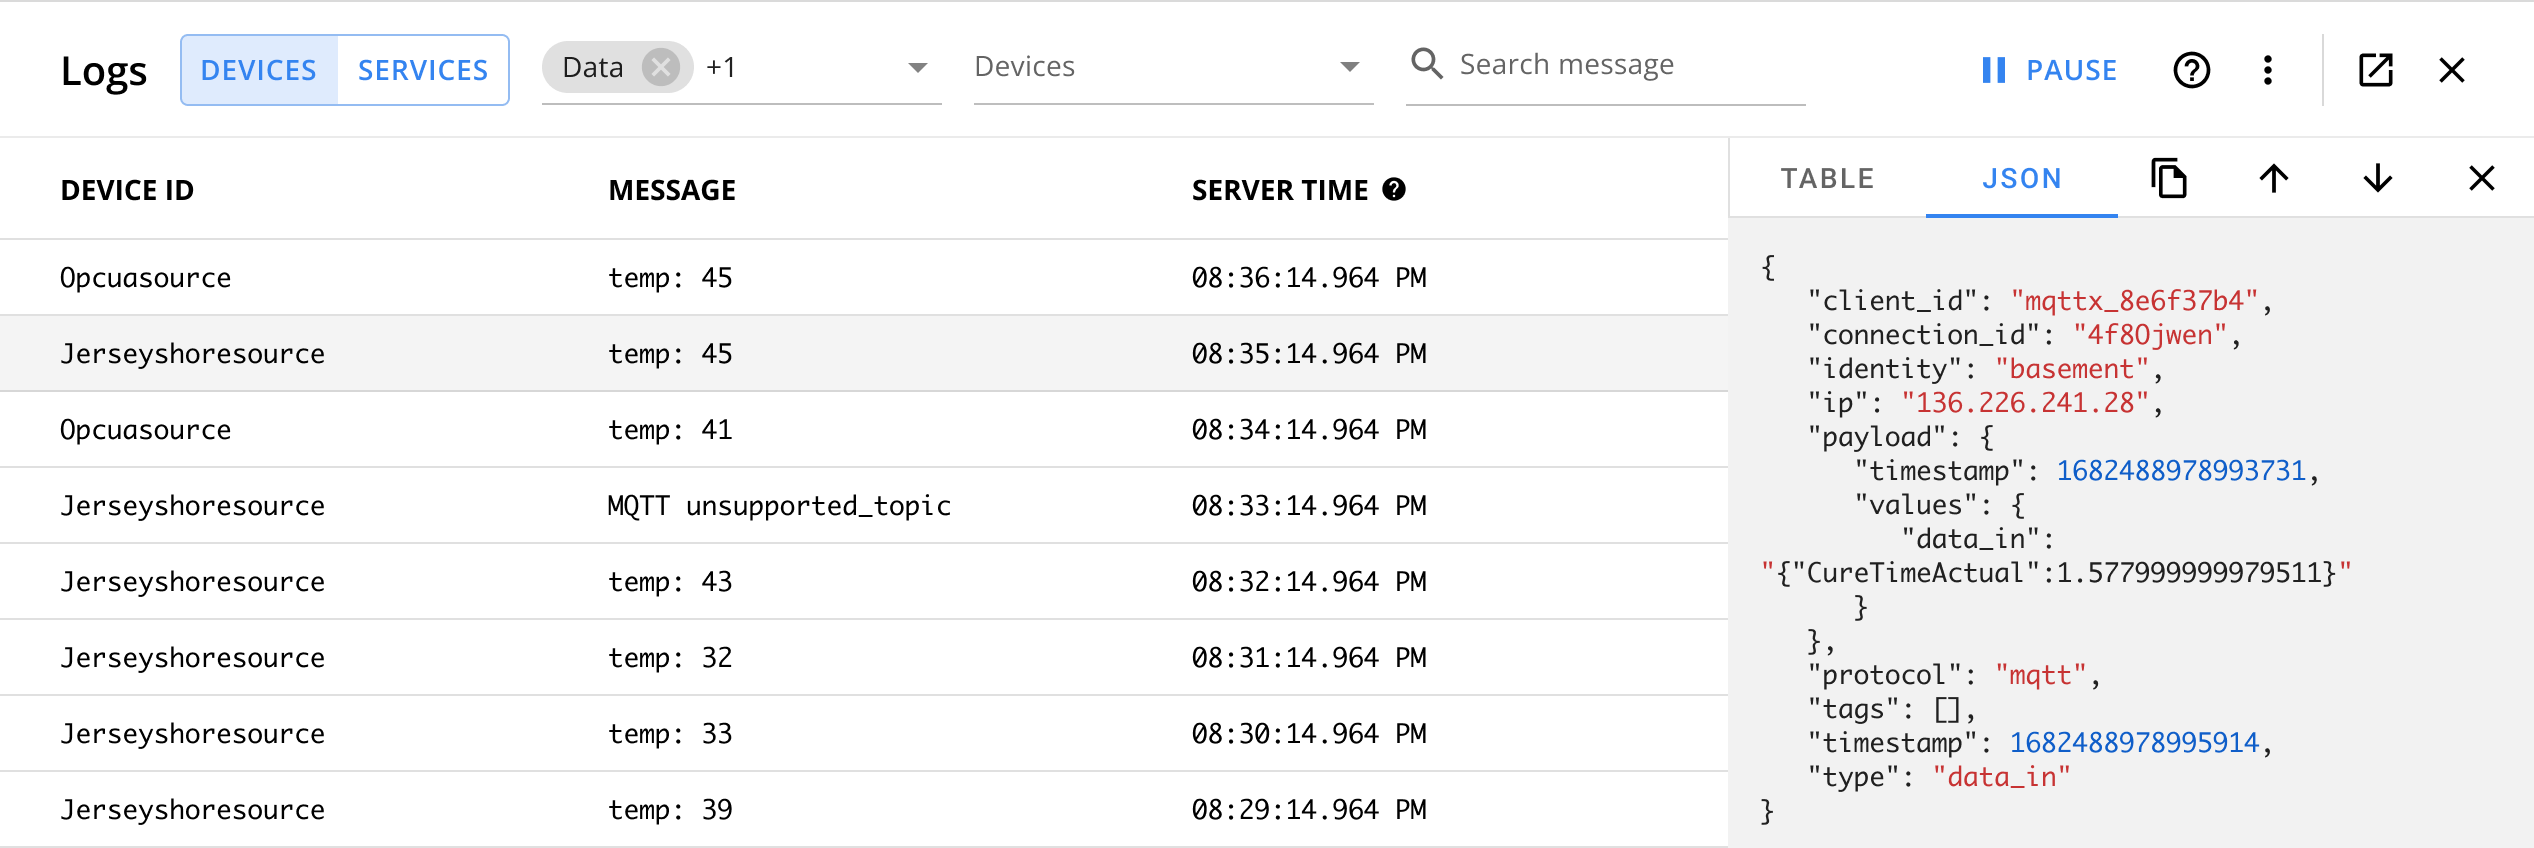
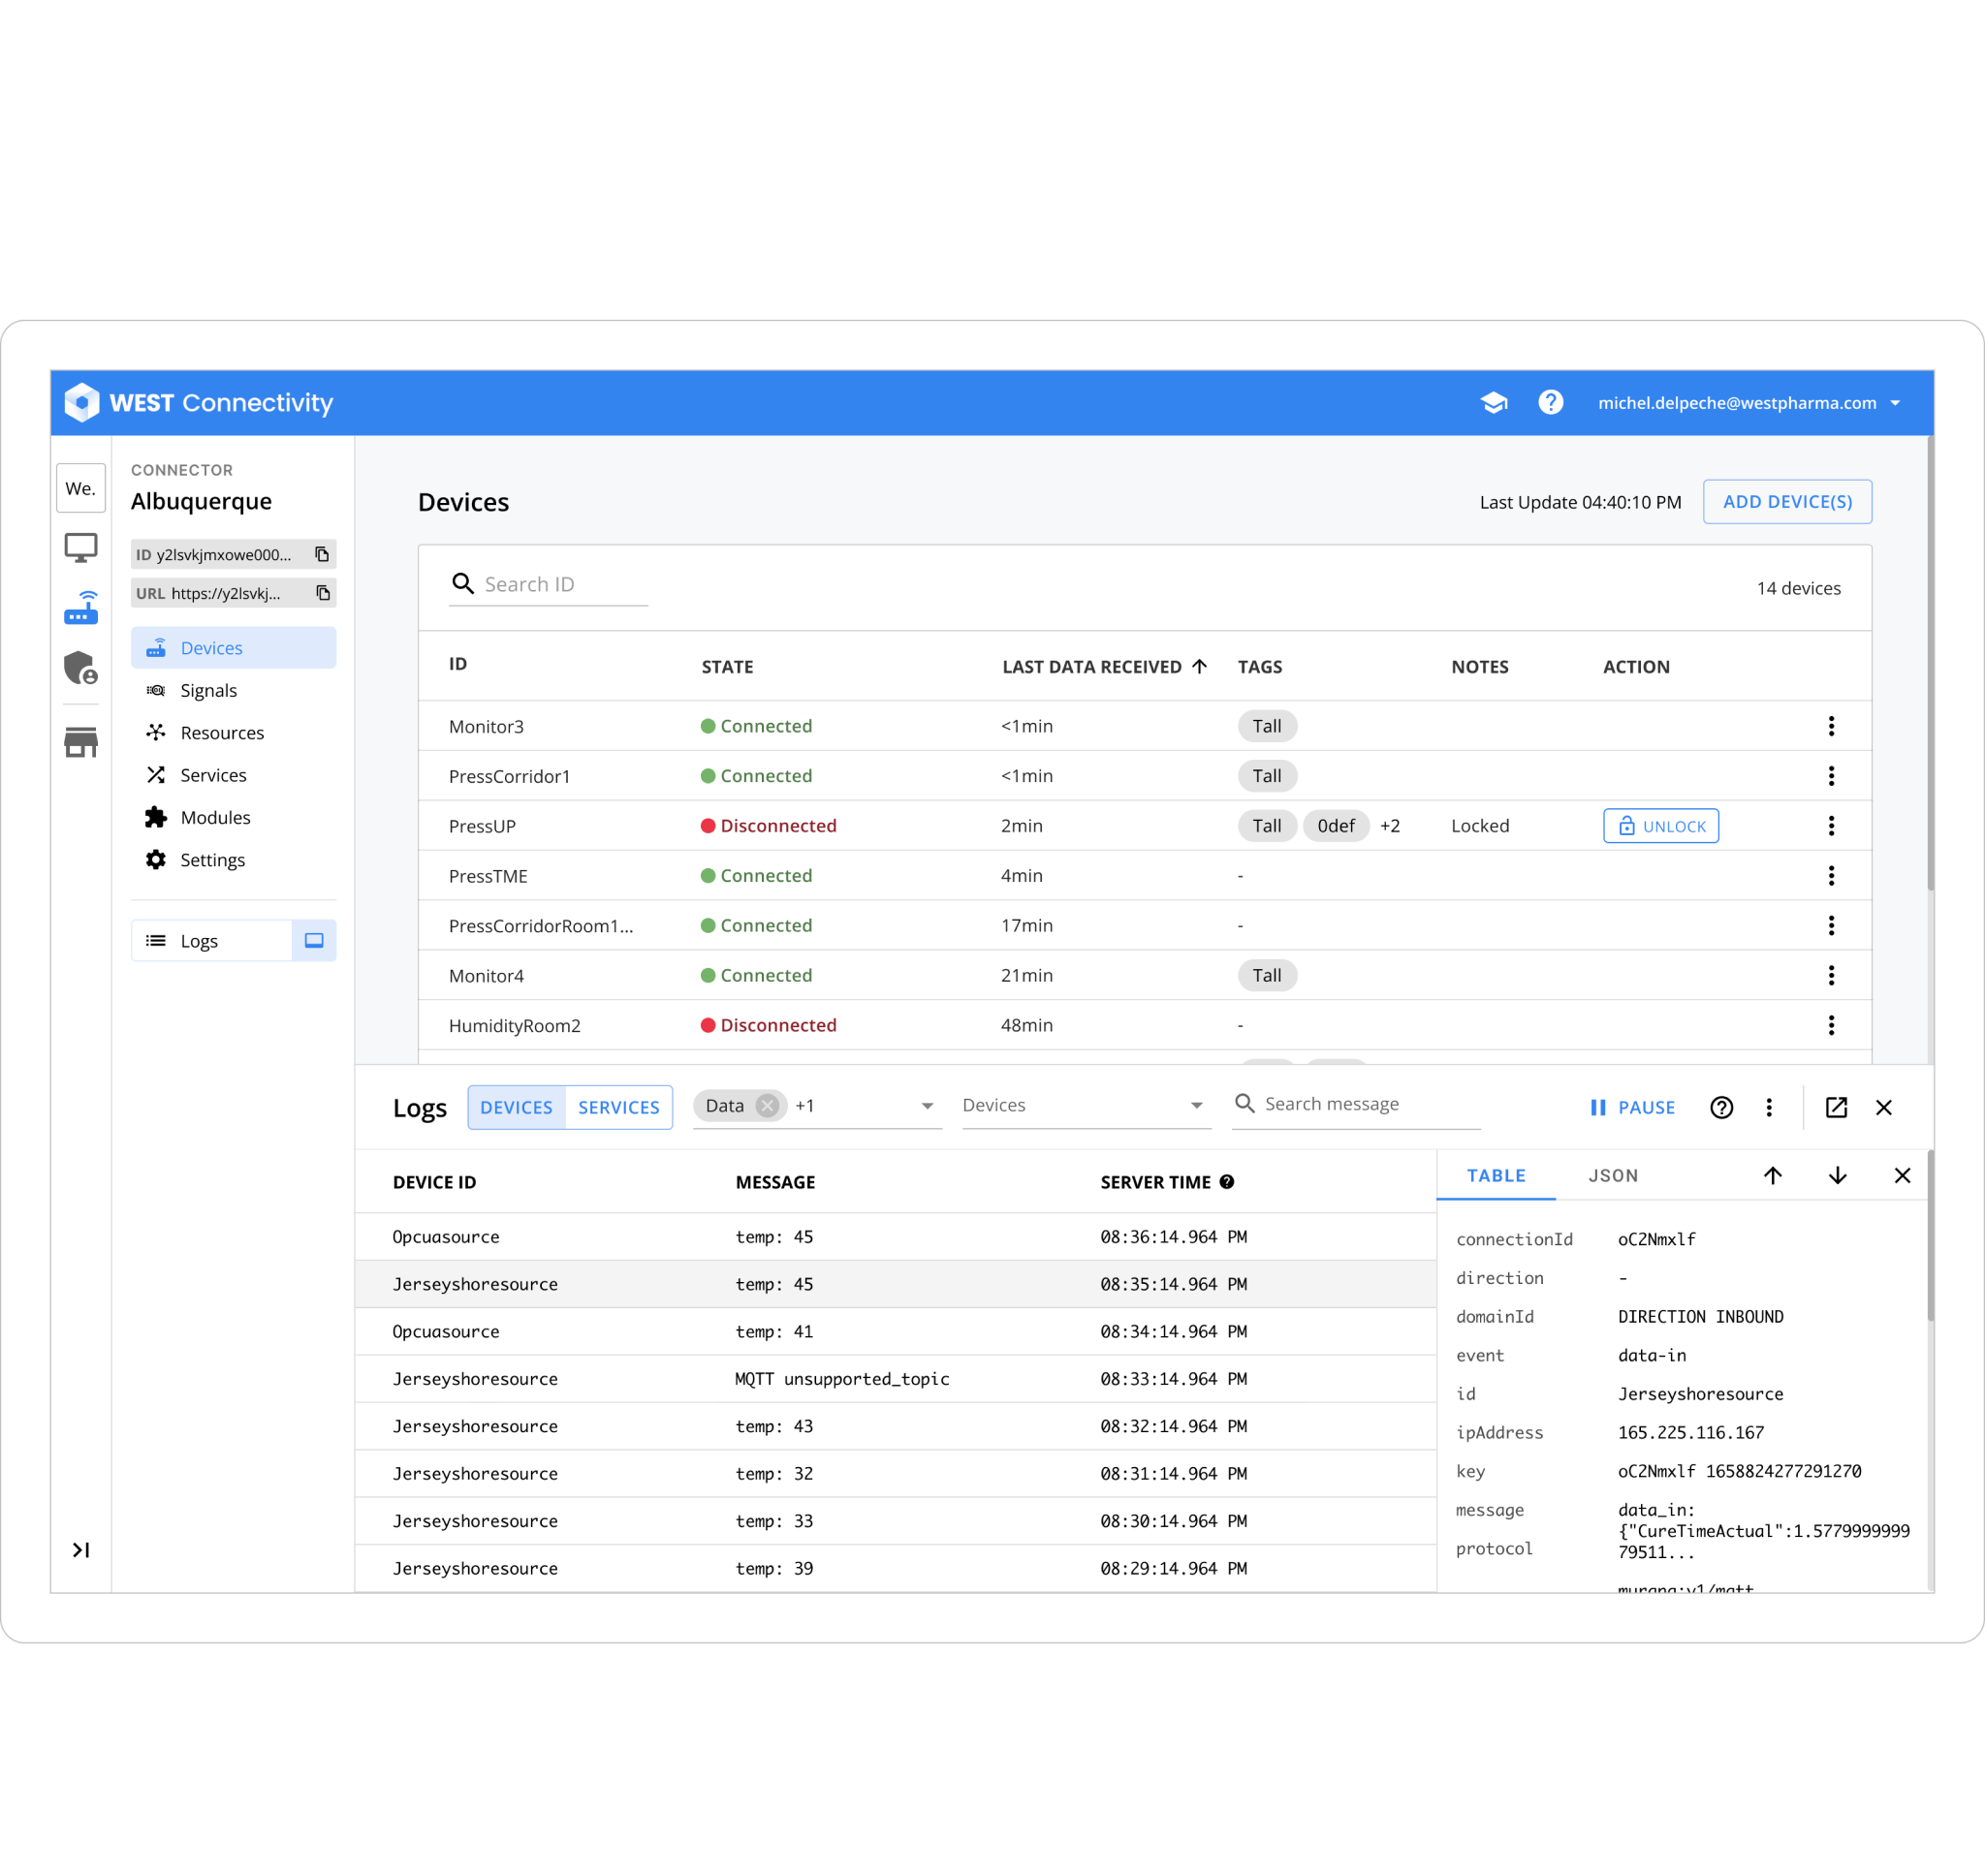
While coding, engineers need to track errors back to their source, and get context on what happened leading up to the problem. Those information are provided by the logs. How to ease troubleshooting for engineers? How to bring trustworthiness in IoT Platform?
Complex systems might bring complex logs structure. For this 1st stage I had to get an overview of how our users (engineers) leverage logs to debug and troubleshoot.
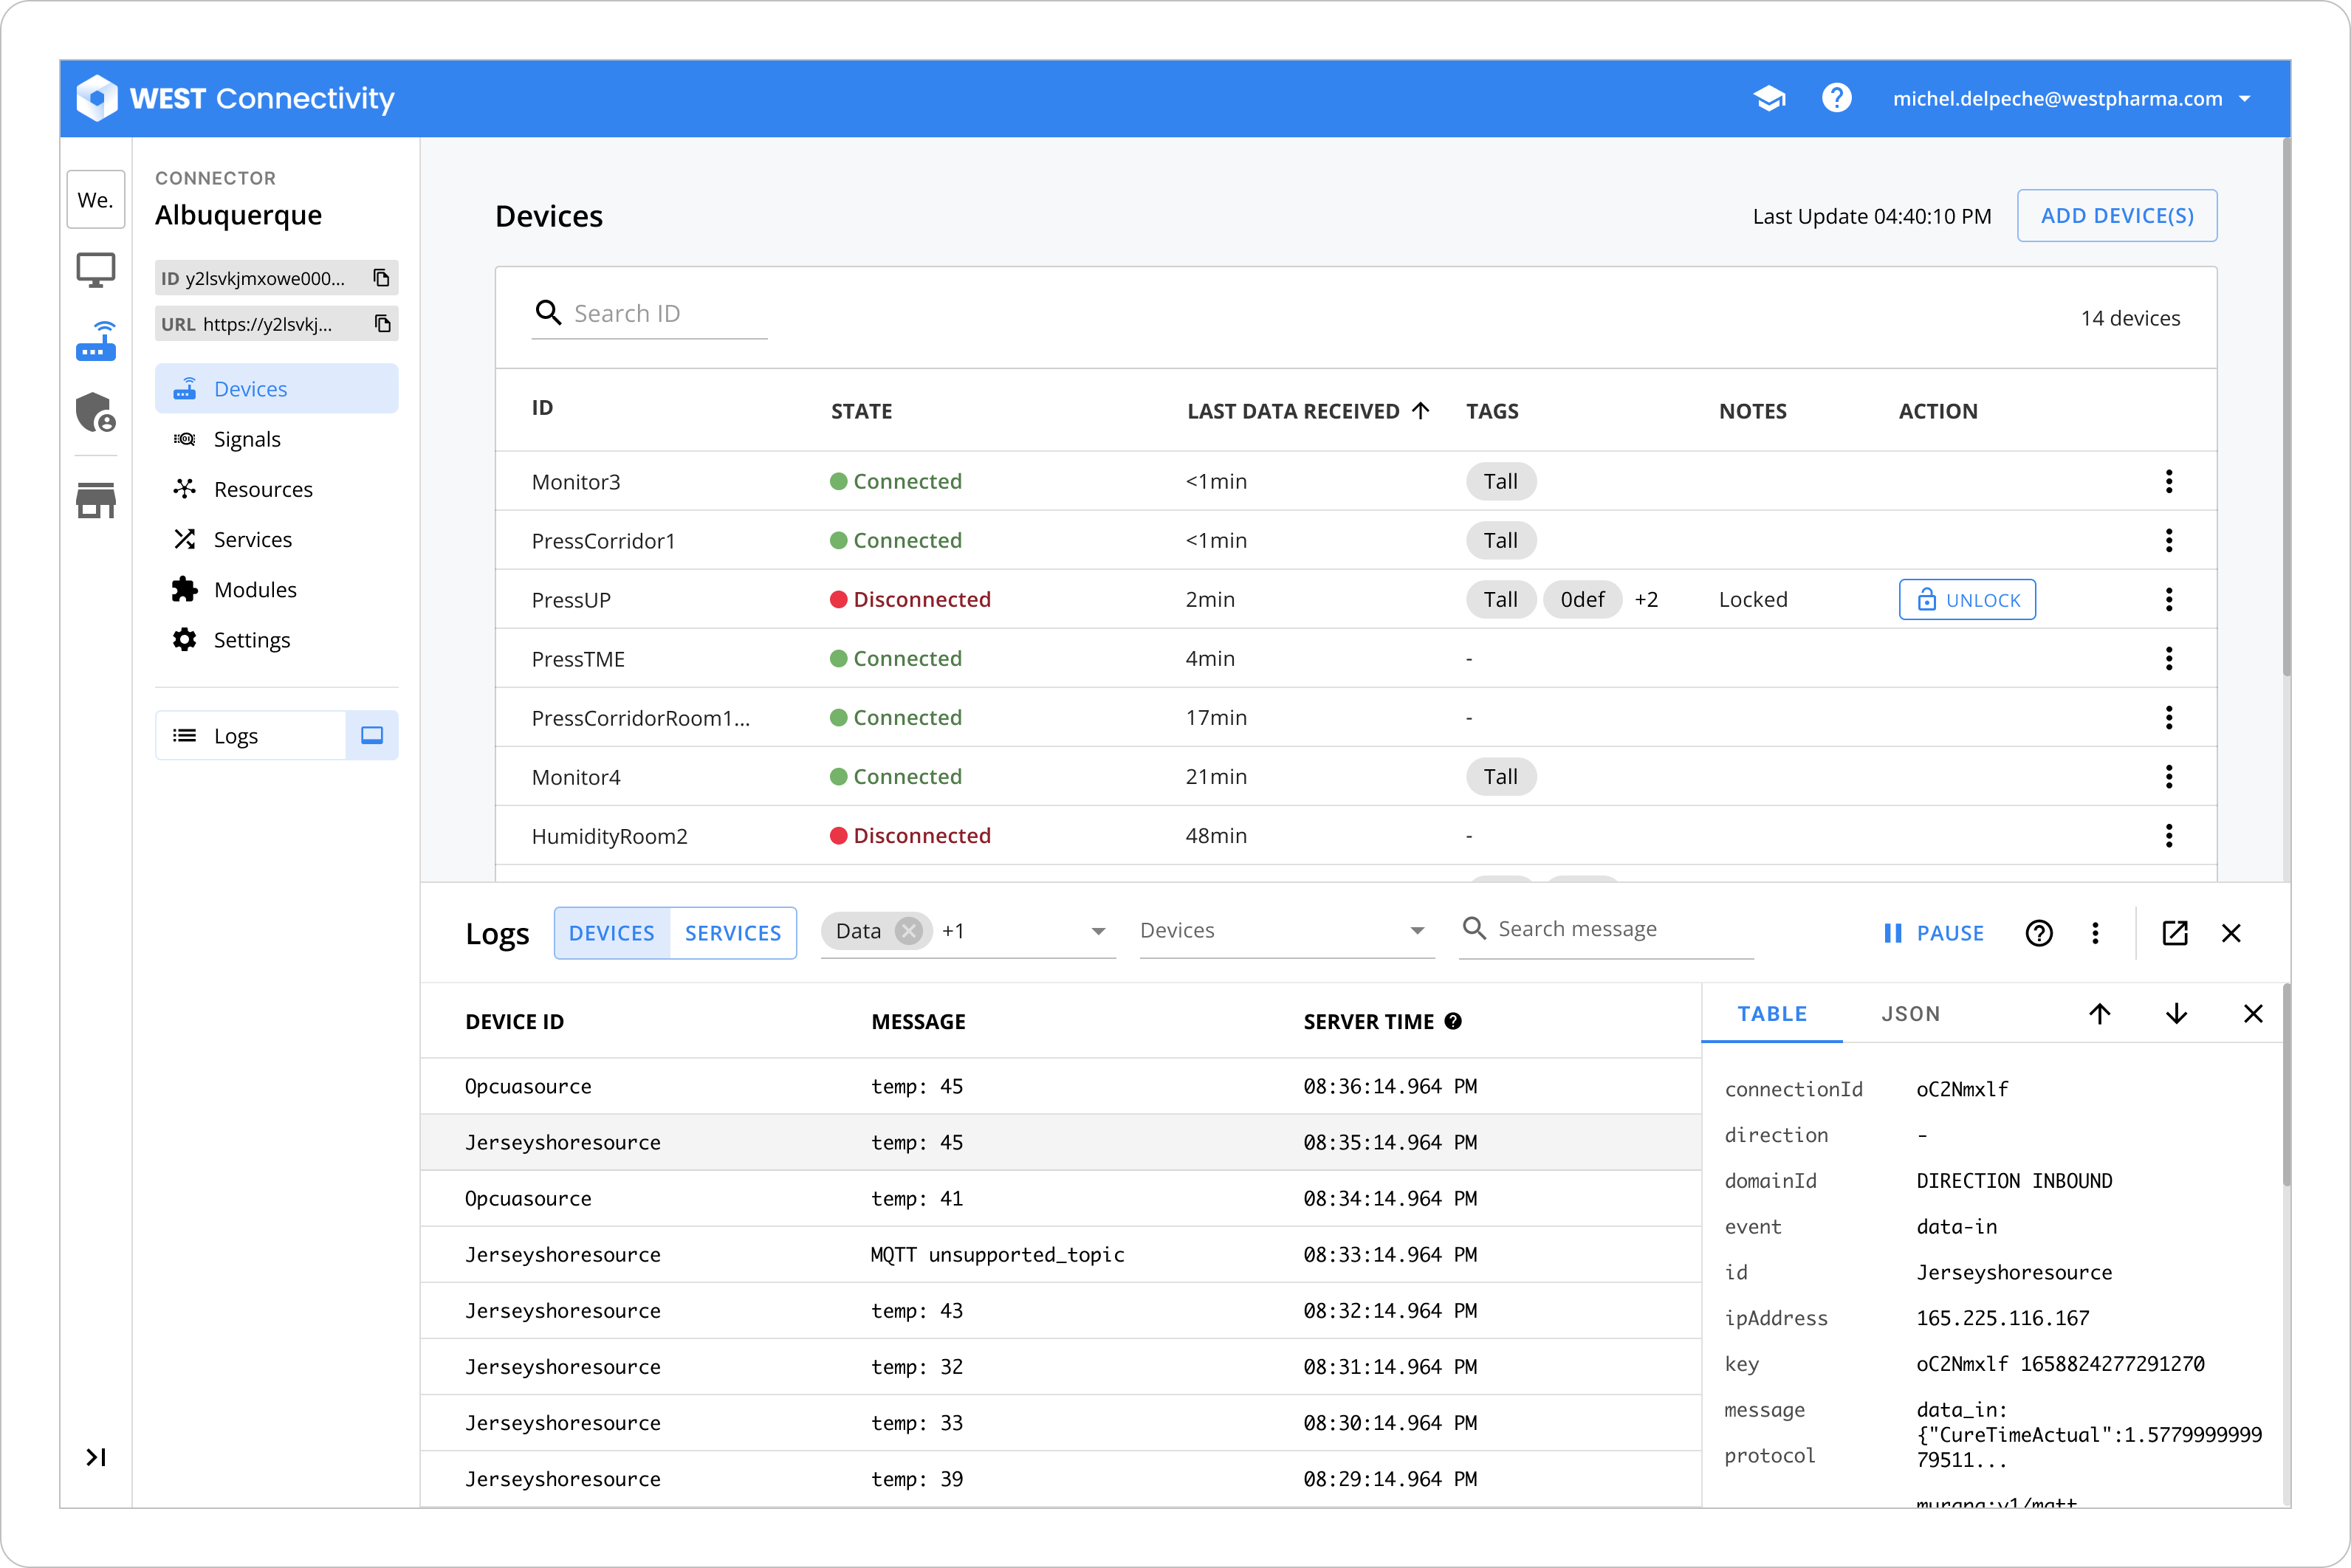
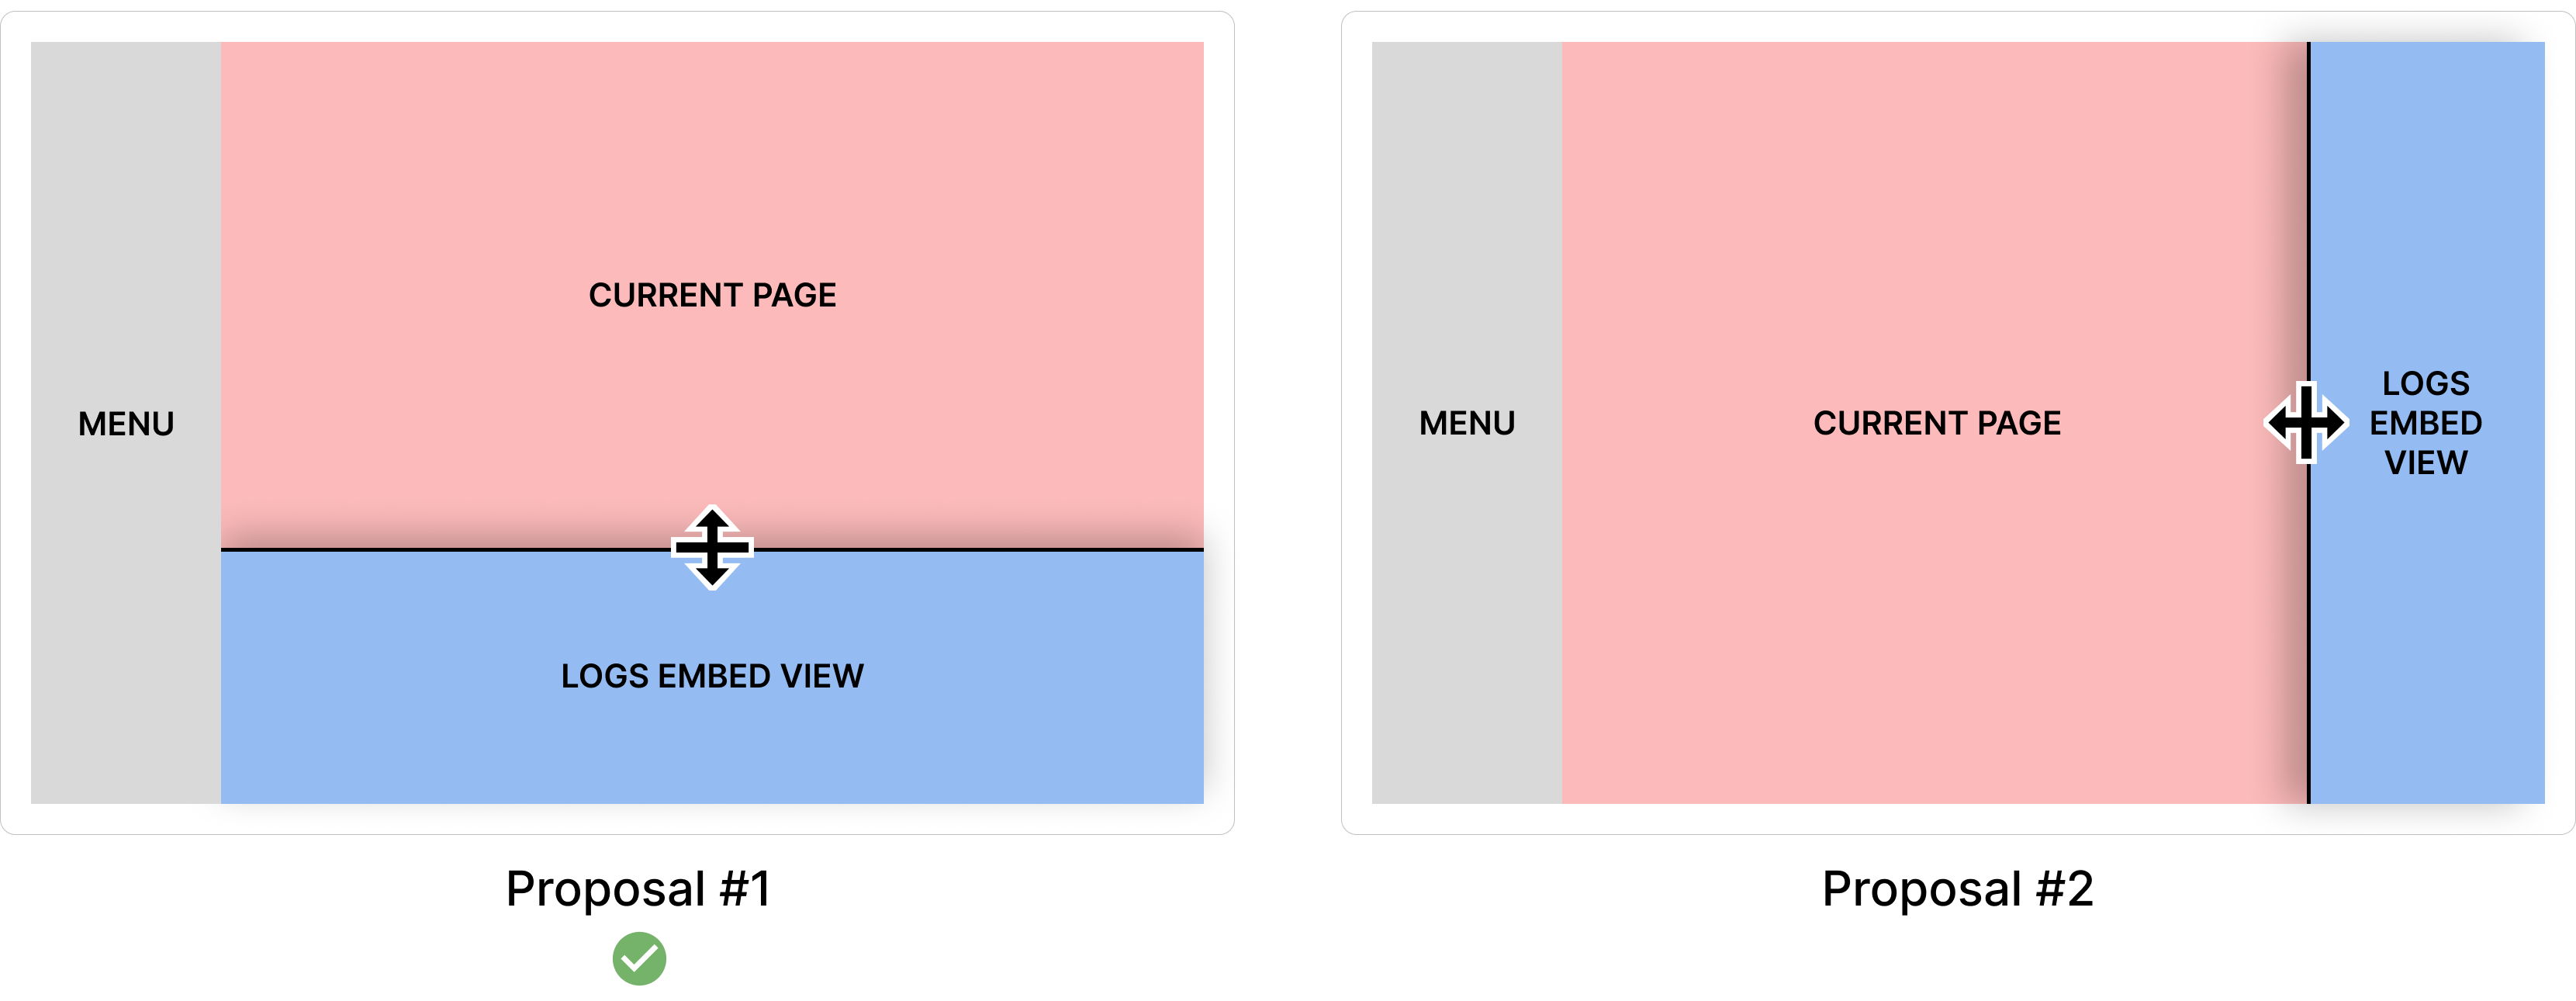
From this stage, we learnt that most of engineers use 2 screens: the laptop and an external monitor.
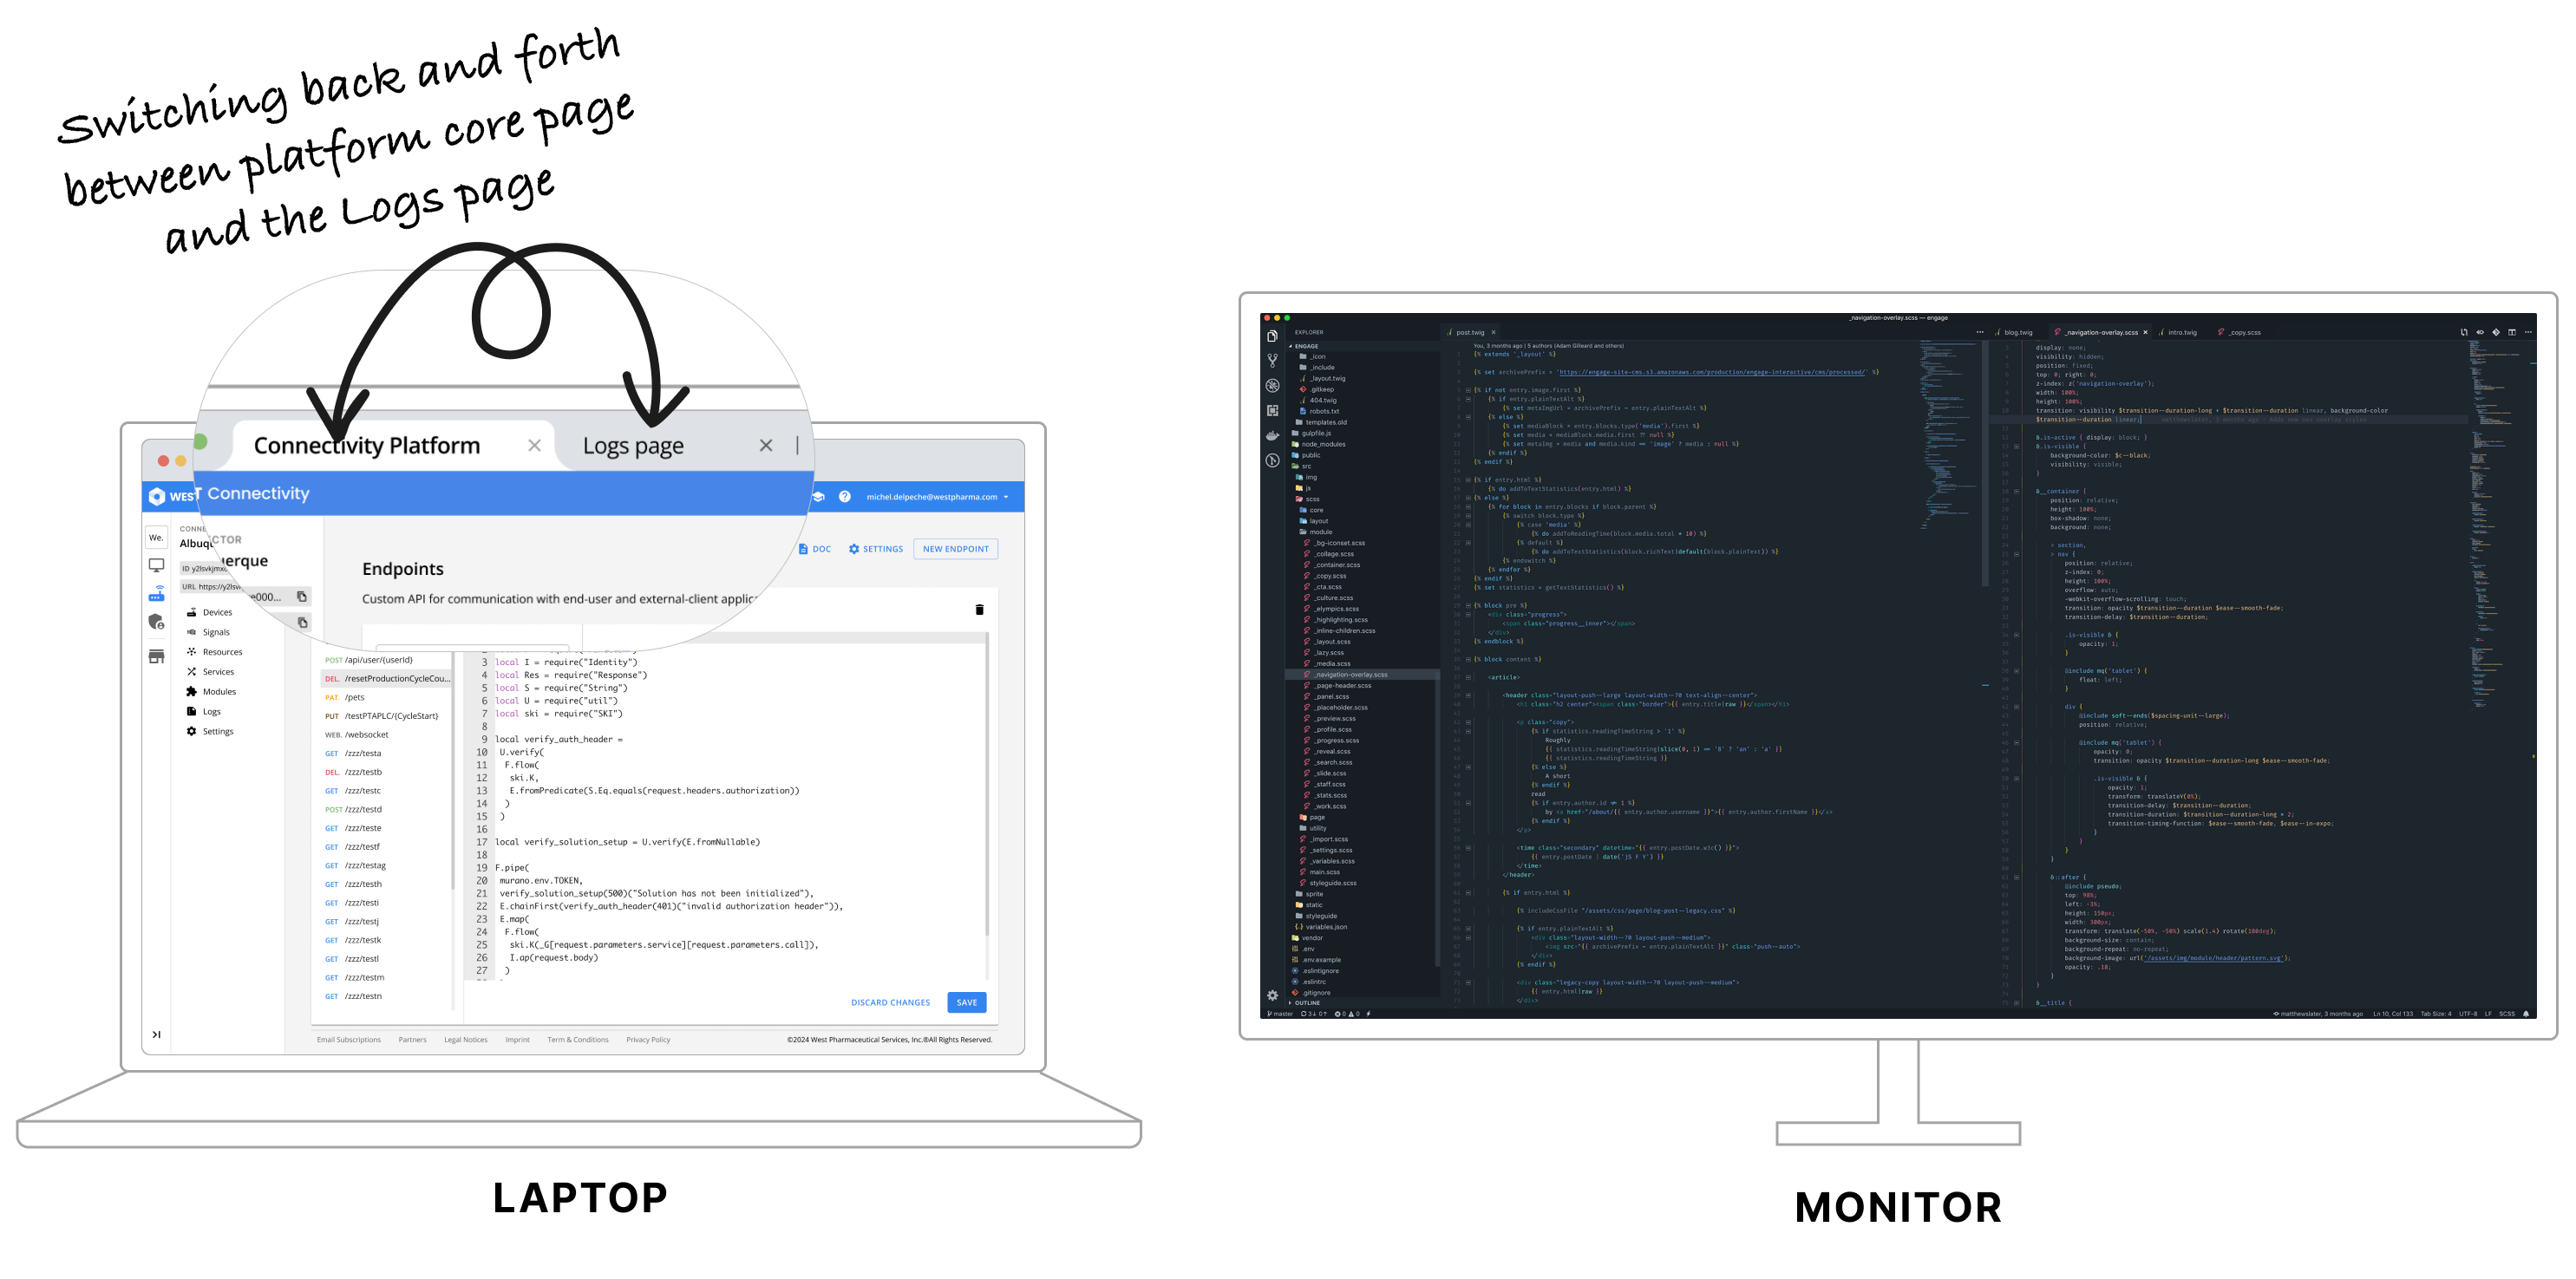
We realised users perform actions that need those two tabs to be opened. They often go back and forth between the two tabs, which slow down the debugging process.
Right below is a sum-up of the flow from challenge pain point/challenge down to the design solution.
After cleaning-up the qualitative data, I came up with 2 users journey map (UJM) and 1 empathy map. The UJM: “I want to troubleshoot my device connection” is the one that brought us the most value-added design solutions.
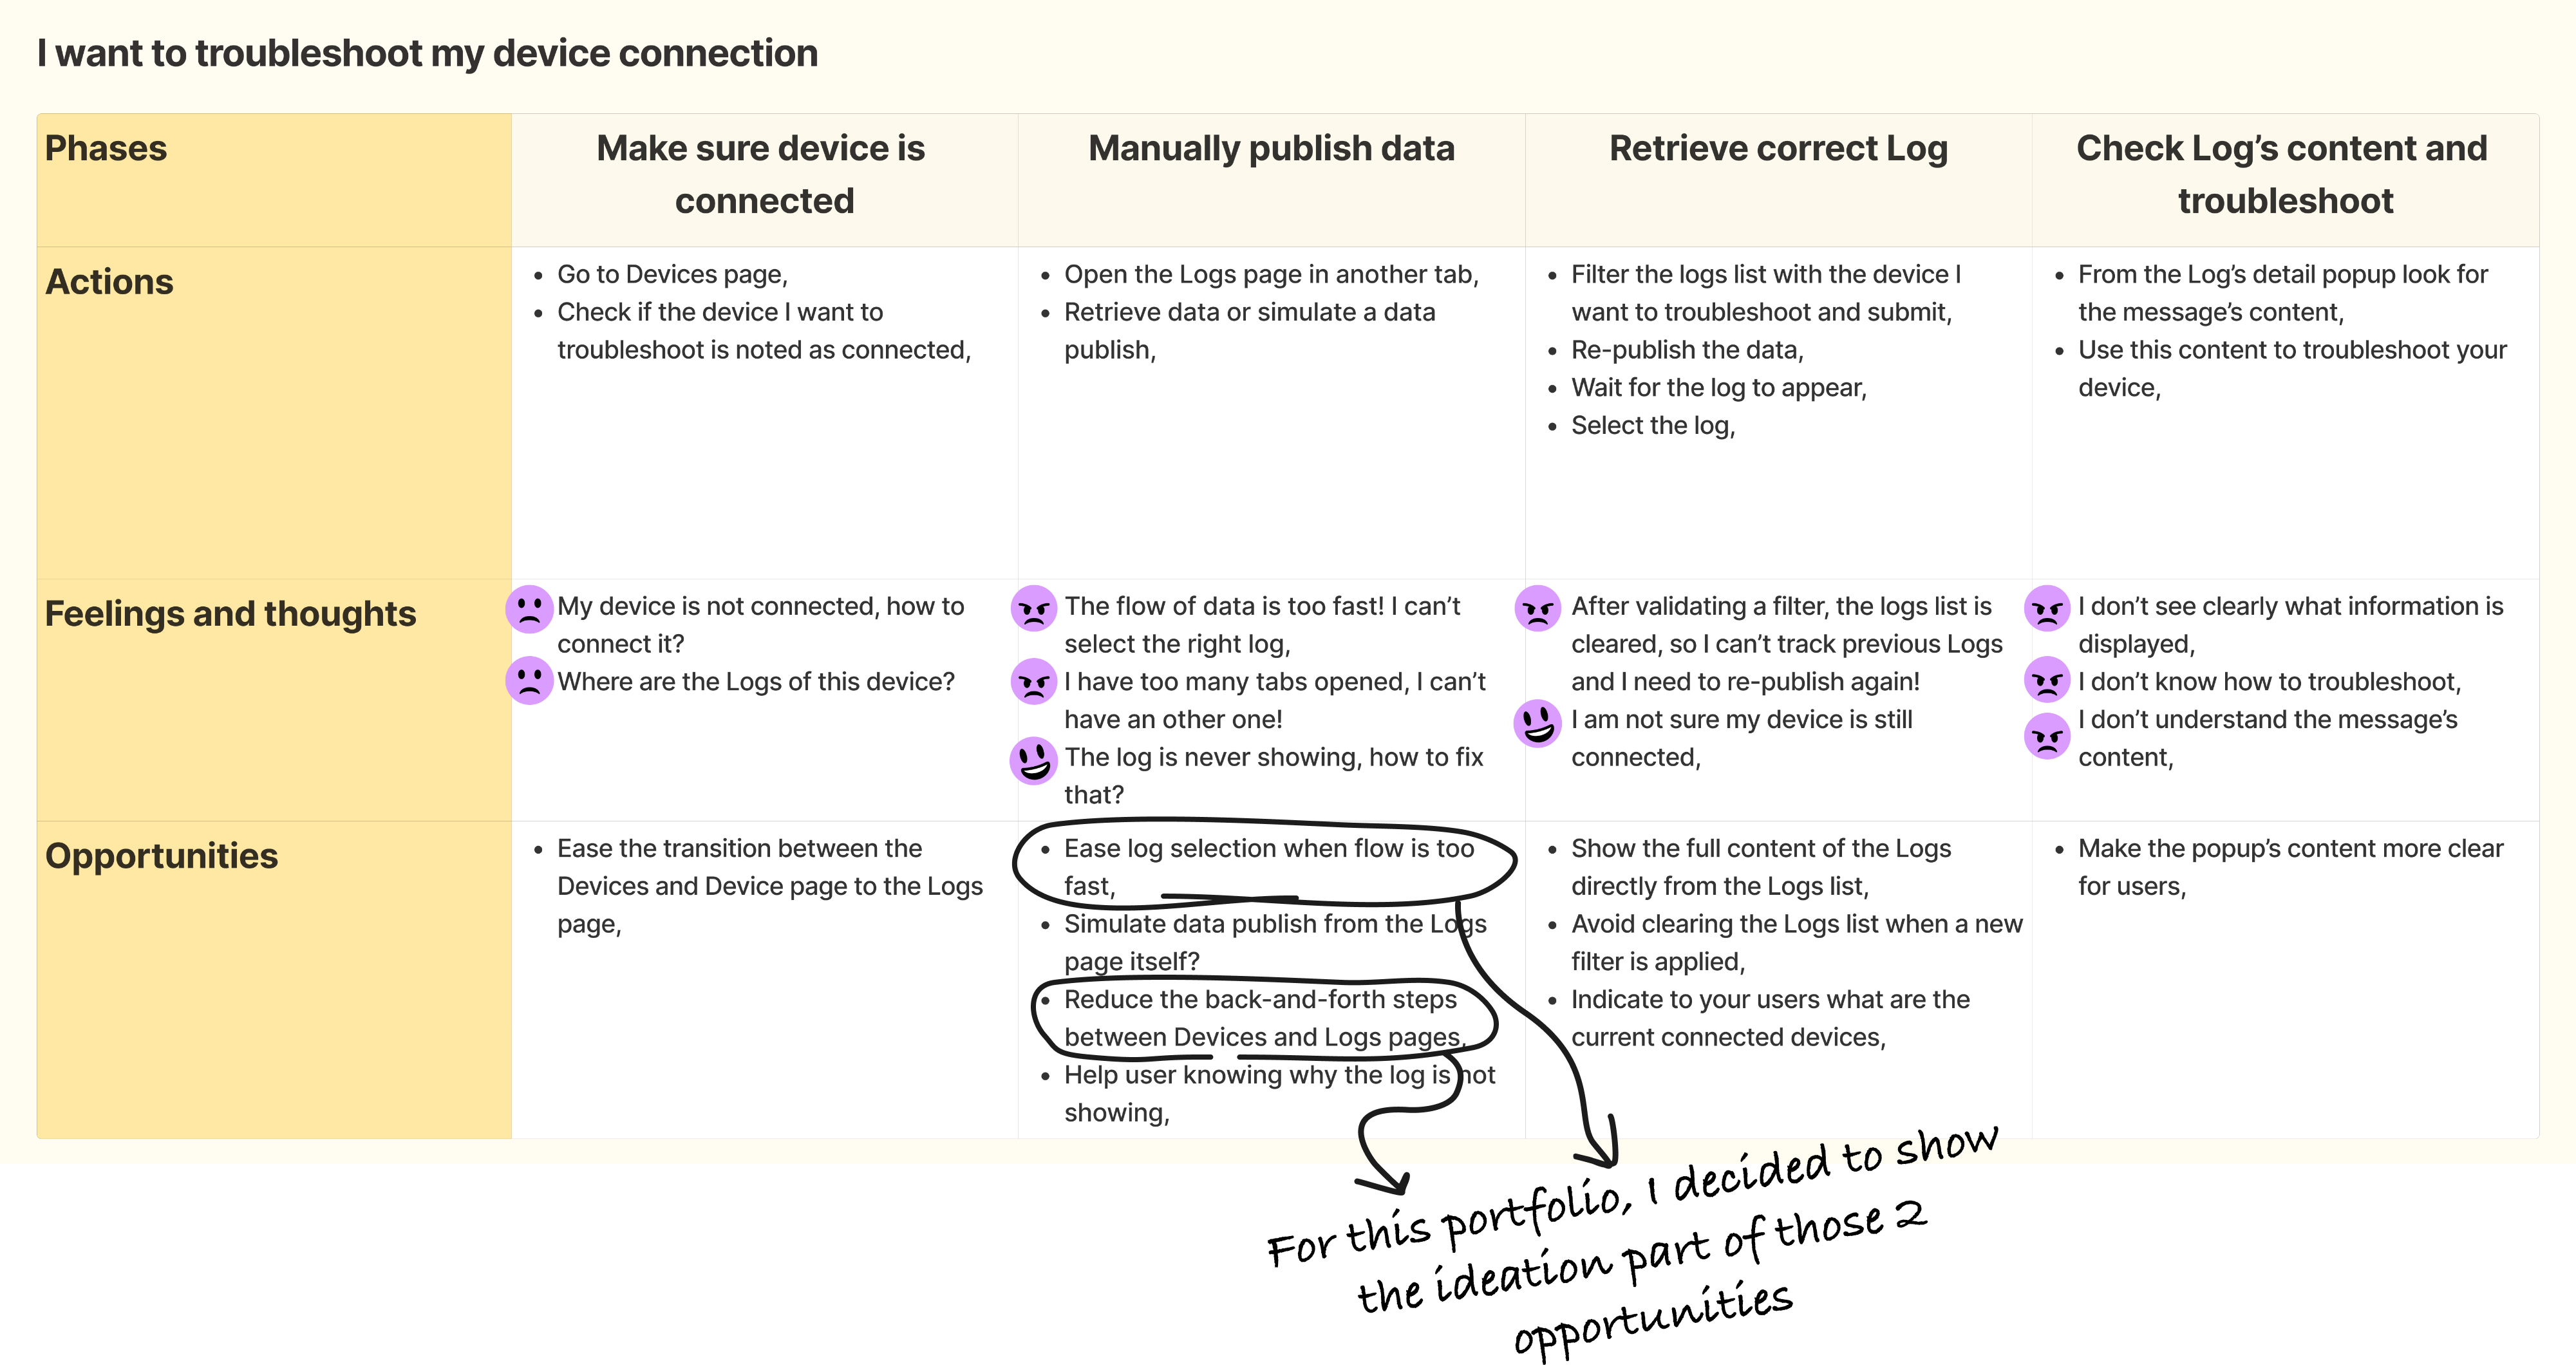
Unfortunately, I didn’t have the opportunity to ideate with final users. Although, I leveraged the qualitative data gathered at the ‘Emphasise’ stage. The observation’s insights have been a great tool for coming up solutions.
From the 2 opportunities got at the previous stage, I came up with the following features/enhancements.
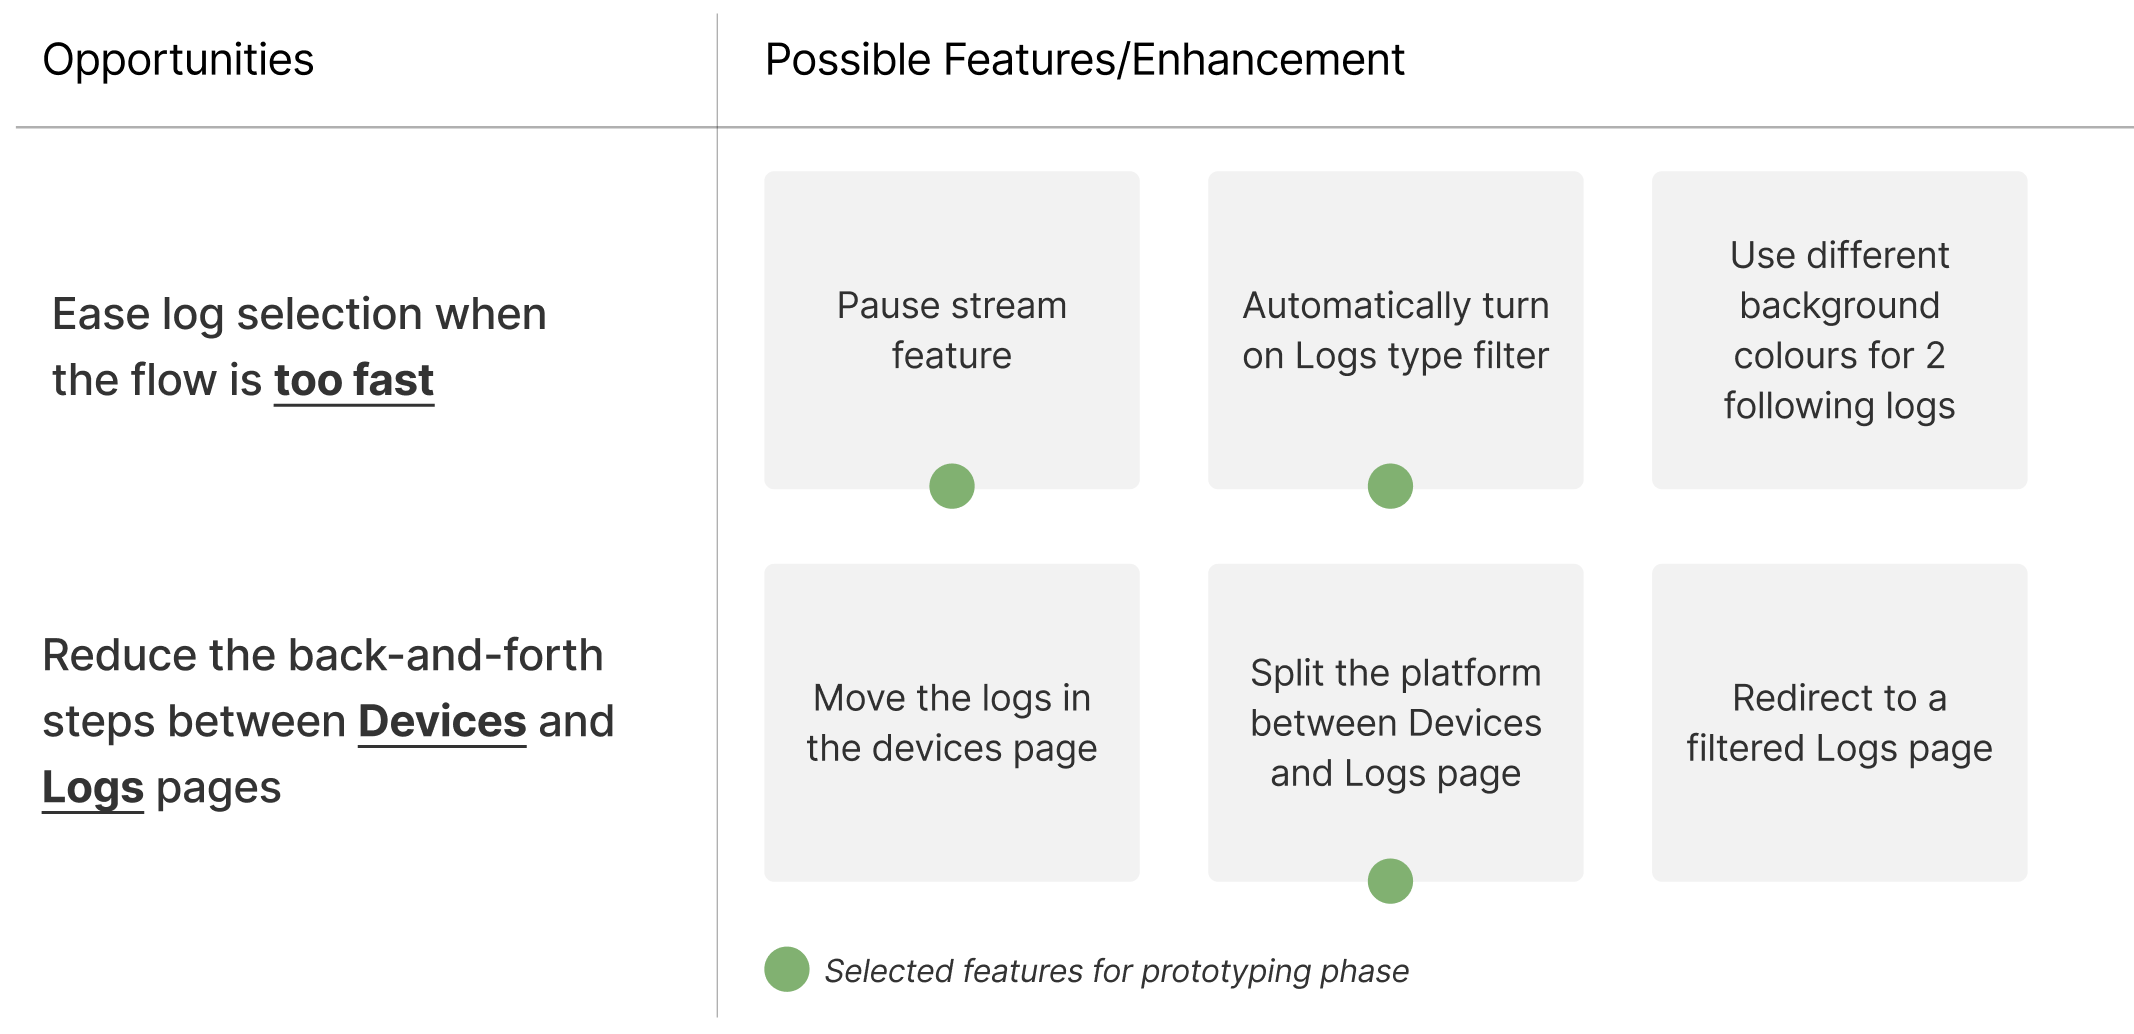
For this portfolio, I've chosen to showcase 2 features that bring strong added value to end users.
I’ve done several iterations from low to high-fidelity mockups and leveraged existing design system.
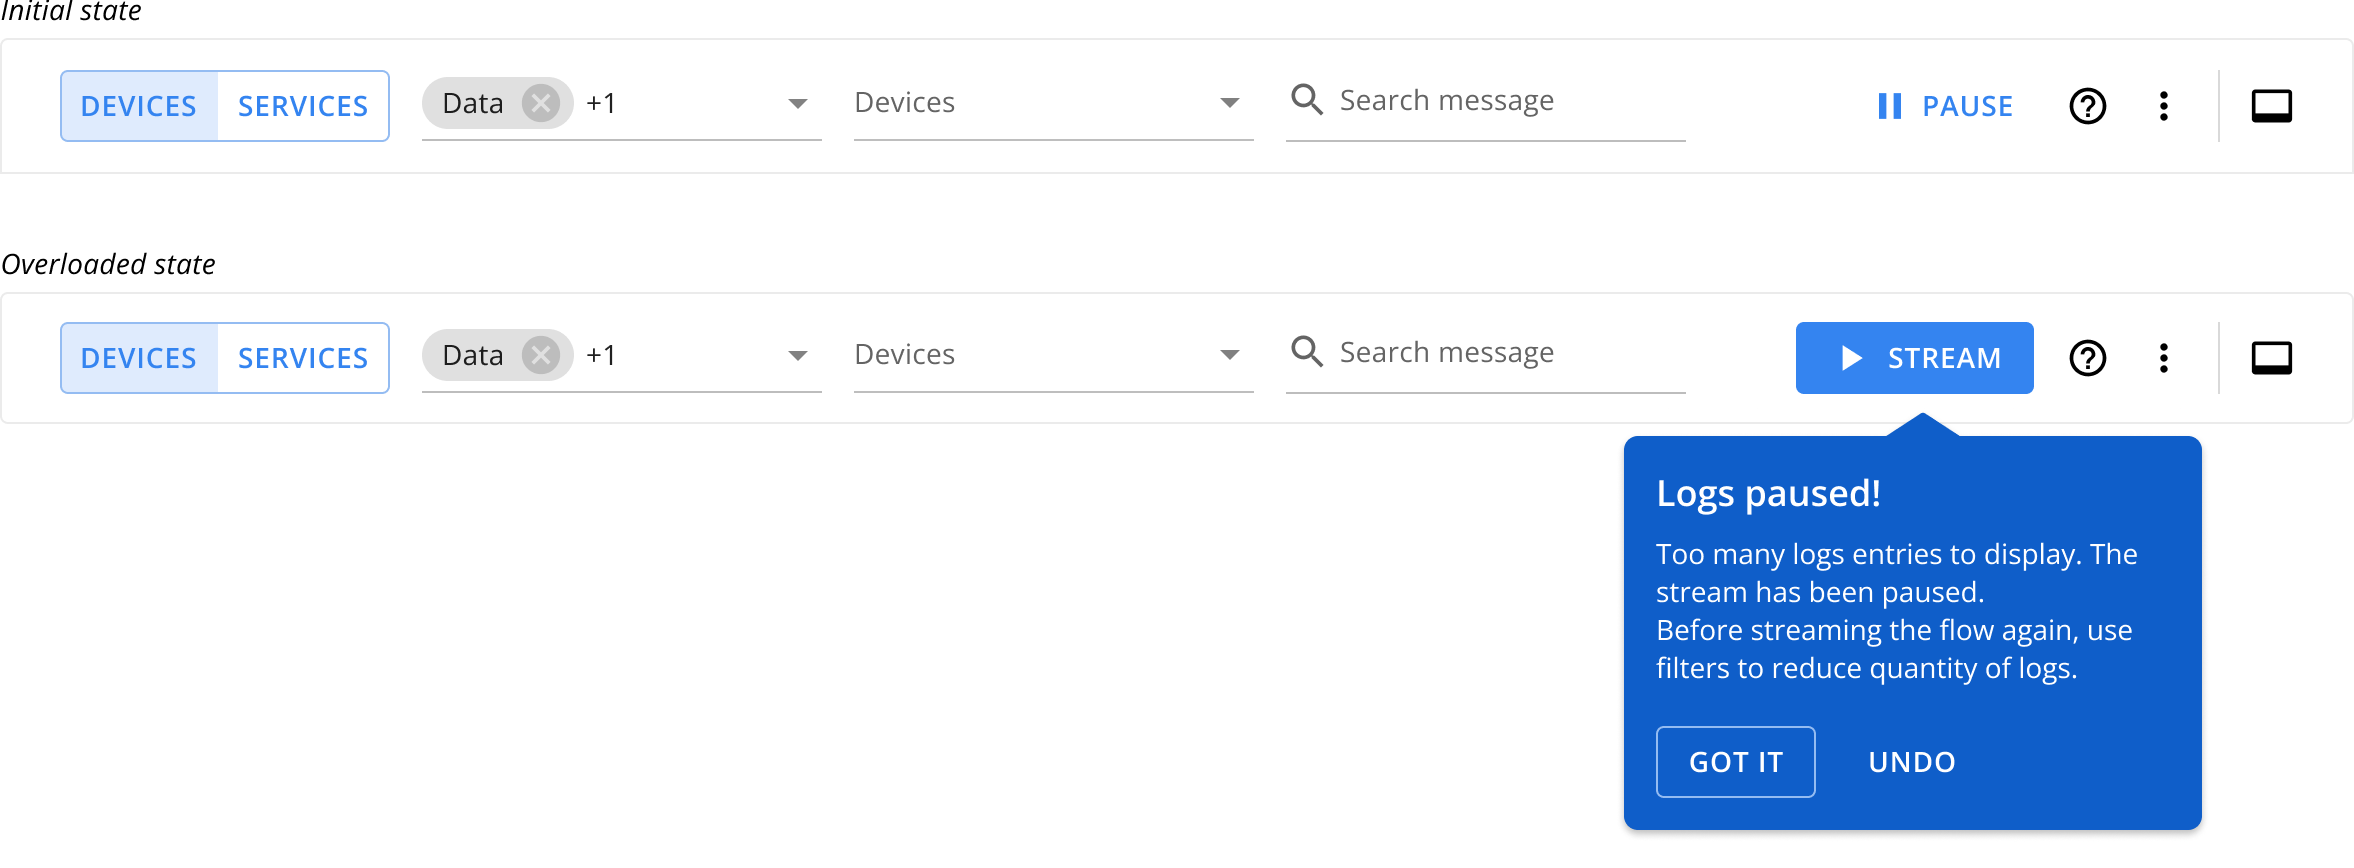
There are two ways to stop stream of logs: manual stop and auto-stopped
The auto-stopped is triggered if the stream reaches the threshold. Then, a tooltip appears which explains to user the reason for auto-stopping the stream.
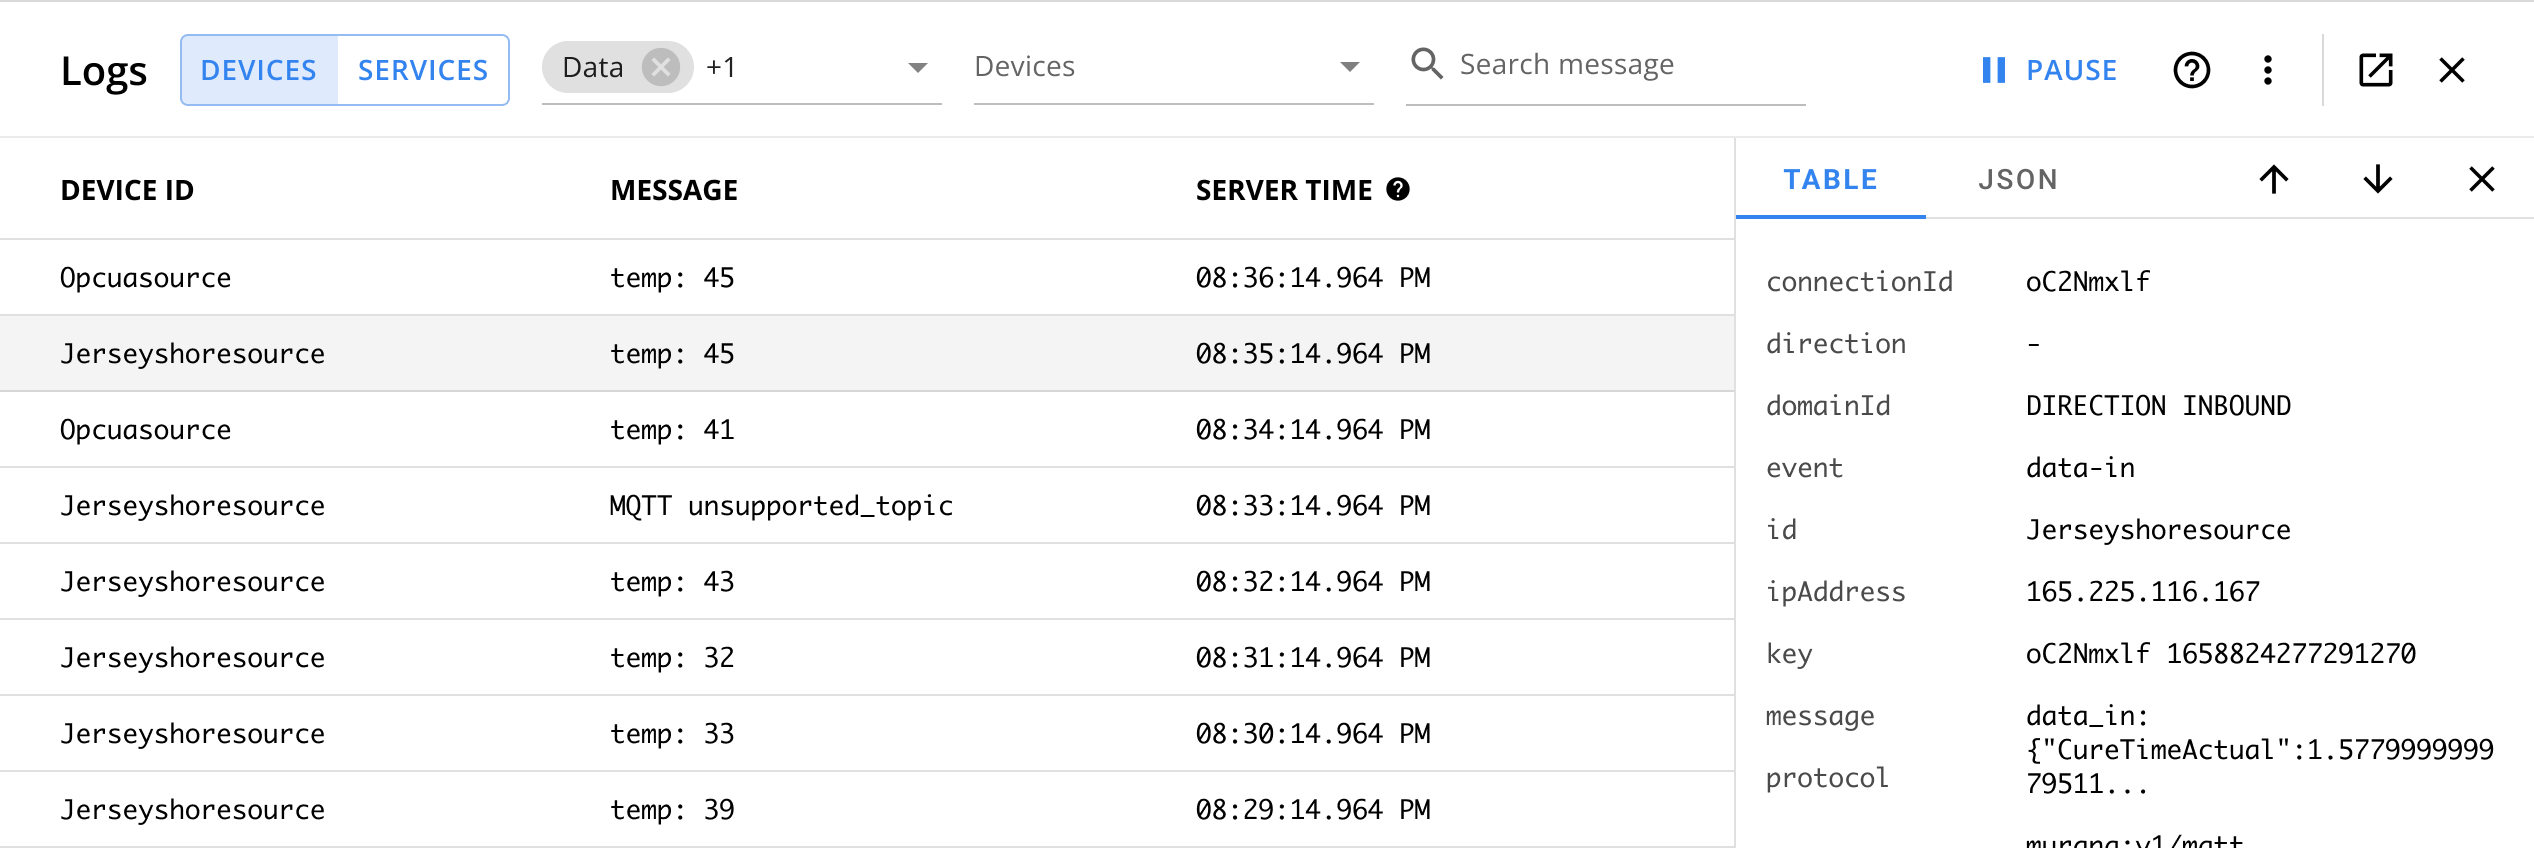
Where and how to show this embed view?
A log consists in: device ID, message, and timestamp. The device ID and timestamp are short string chain, maximum of 15 characters. Message could be a 200 characters string, but in most of use cases it never goes above 30 characters. From that perspective, logs could be displayed on one row. User are also used to other platforms (e.g., Kibana, Google Cloud) were logs are always showing on one row only.
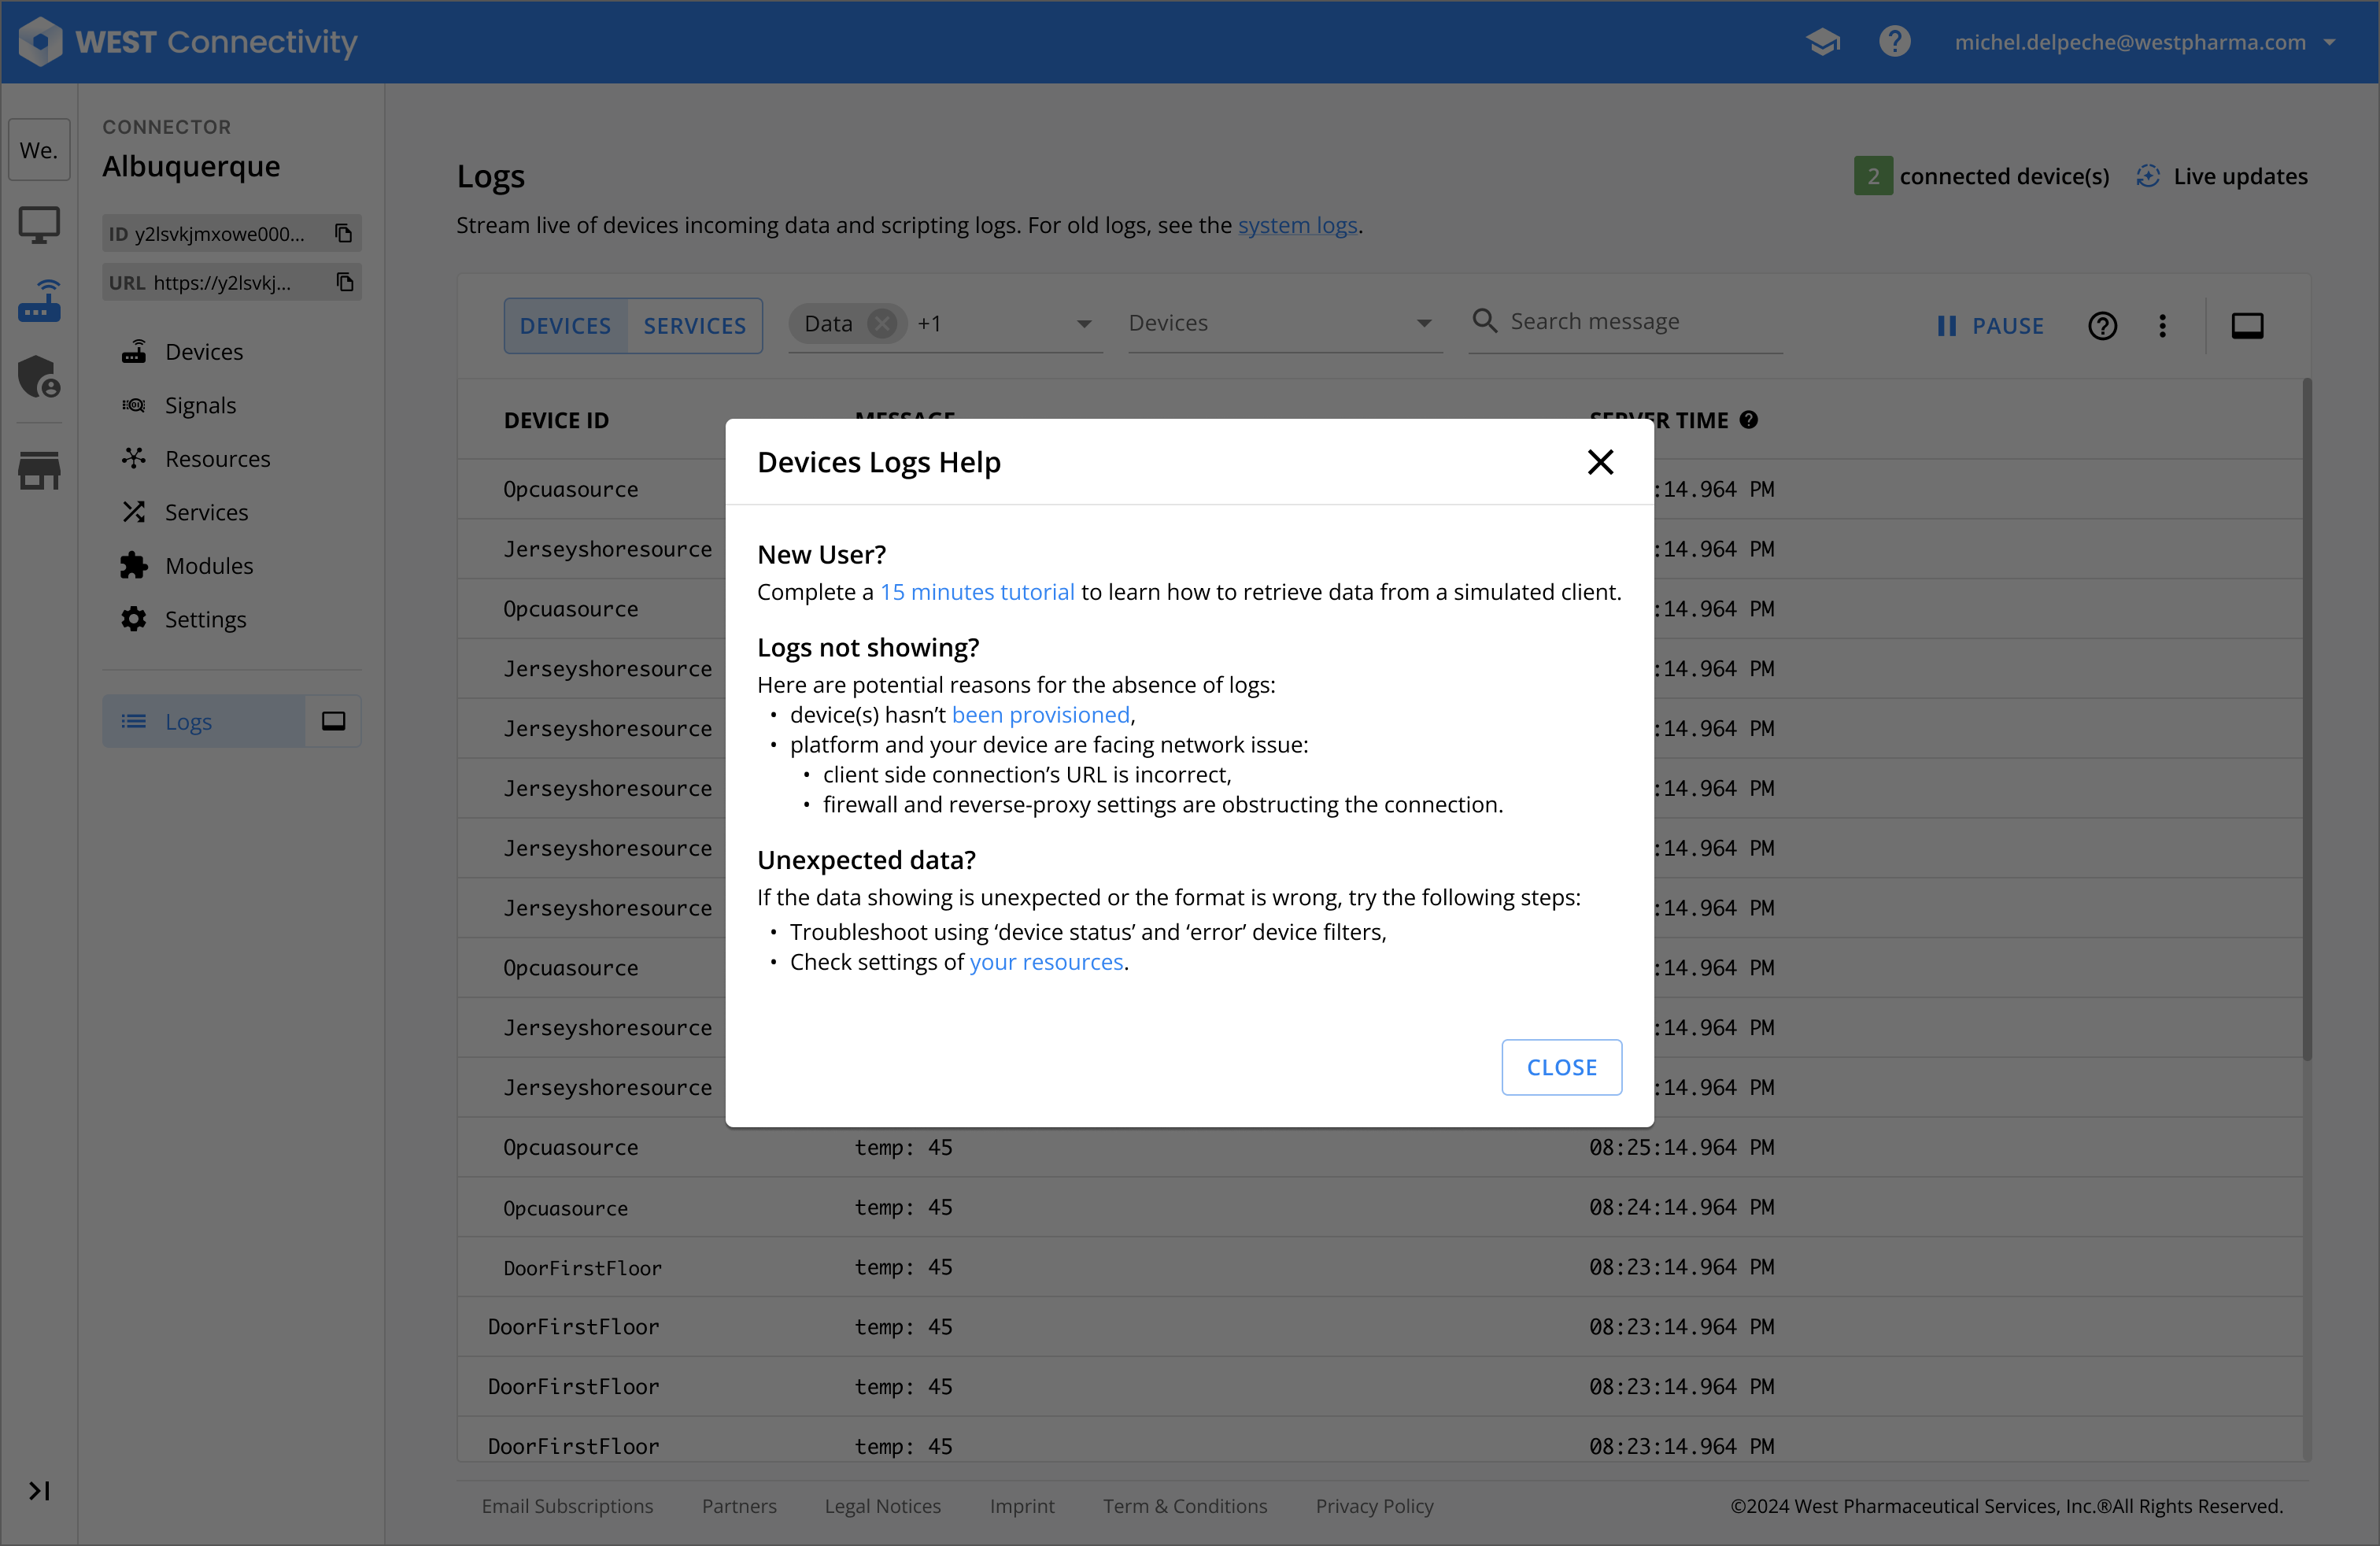
Right below are more designs mockups of components or features belonging to the logs page.
